

Case study · ESFORIN
UX design for energy trading
Modern flexibility marketing with optimal usability. The portal helps structure vast amounts of data and turn them into confident decisions.
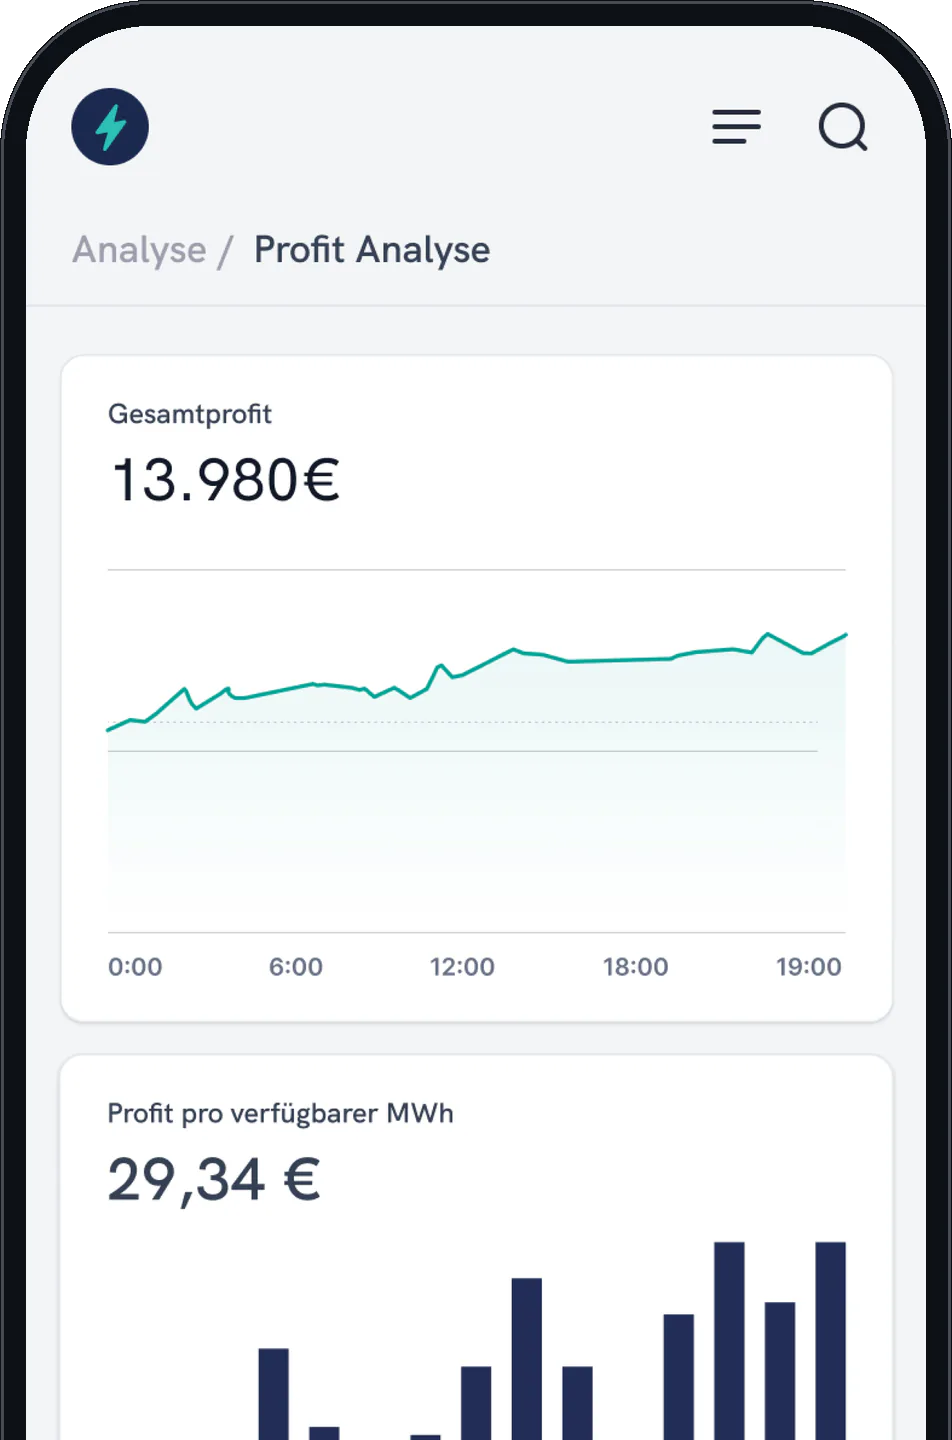
- Client
- ESFORIN
Flexibility marketing in Europe - Services
- Product ownership · Scrum
UX/UI design
Frontend & backend
Cloud · Knowledge transfer - Project period
- 2025
- Technologies
- Figma · Next.js
Tailwind · .NET
Azure · Vercel
A new portal.
A new clarity.
ESFORIN wanted a customer portal where customers report availability and understand the performance of their assets: simple, transparent and reliable. inovex delivered product ownership, design and development.
Four reasons why the portal keeps pace with the market
Our UX and UI decisions at a glance.
UX · Product vision Technology races. We deliver control.
In intraday trading every second counts. The portal turns masses of data into fast, confident decisions.
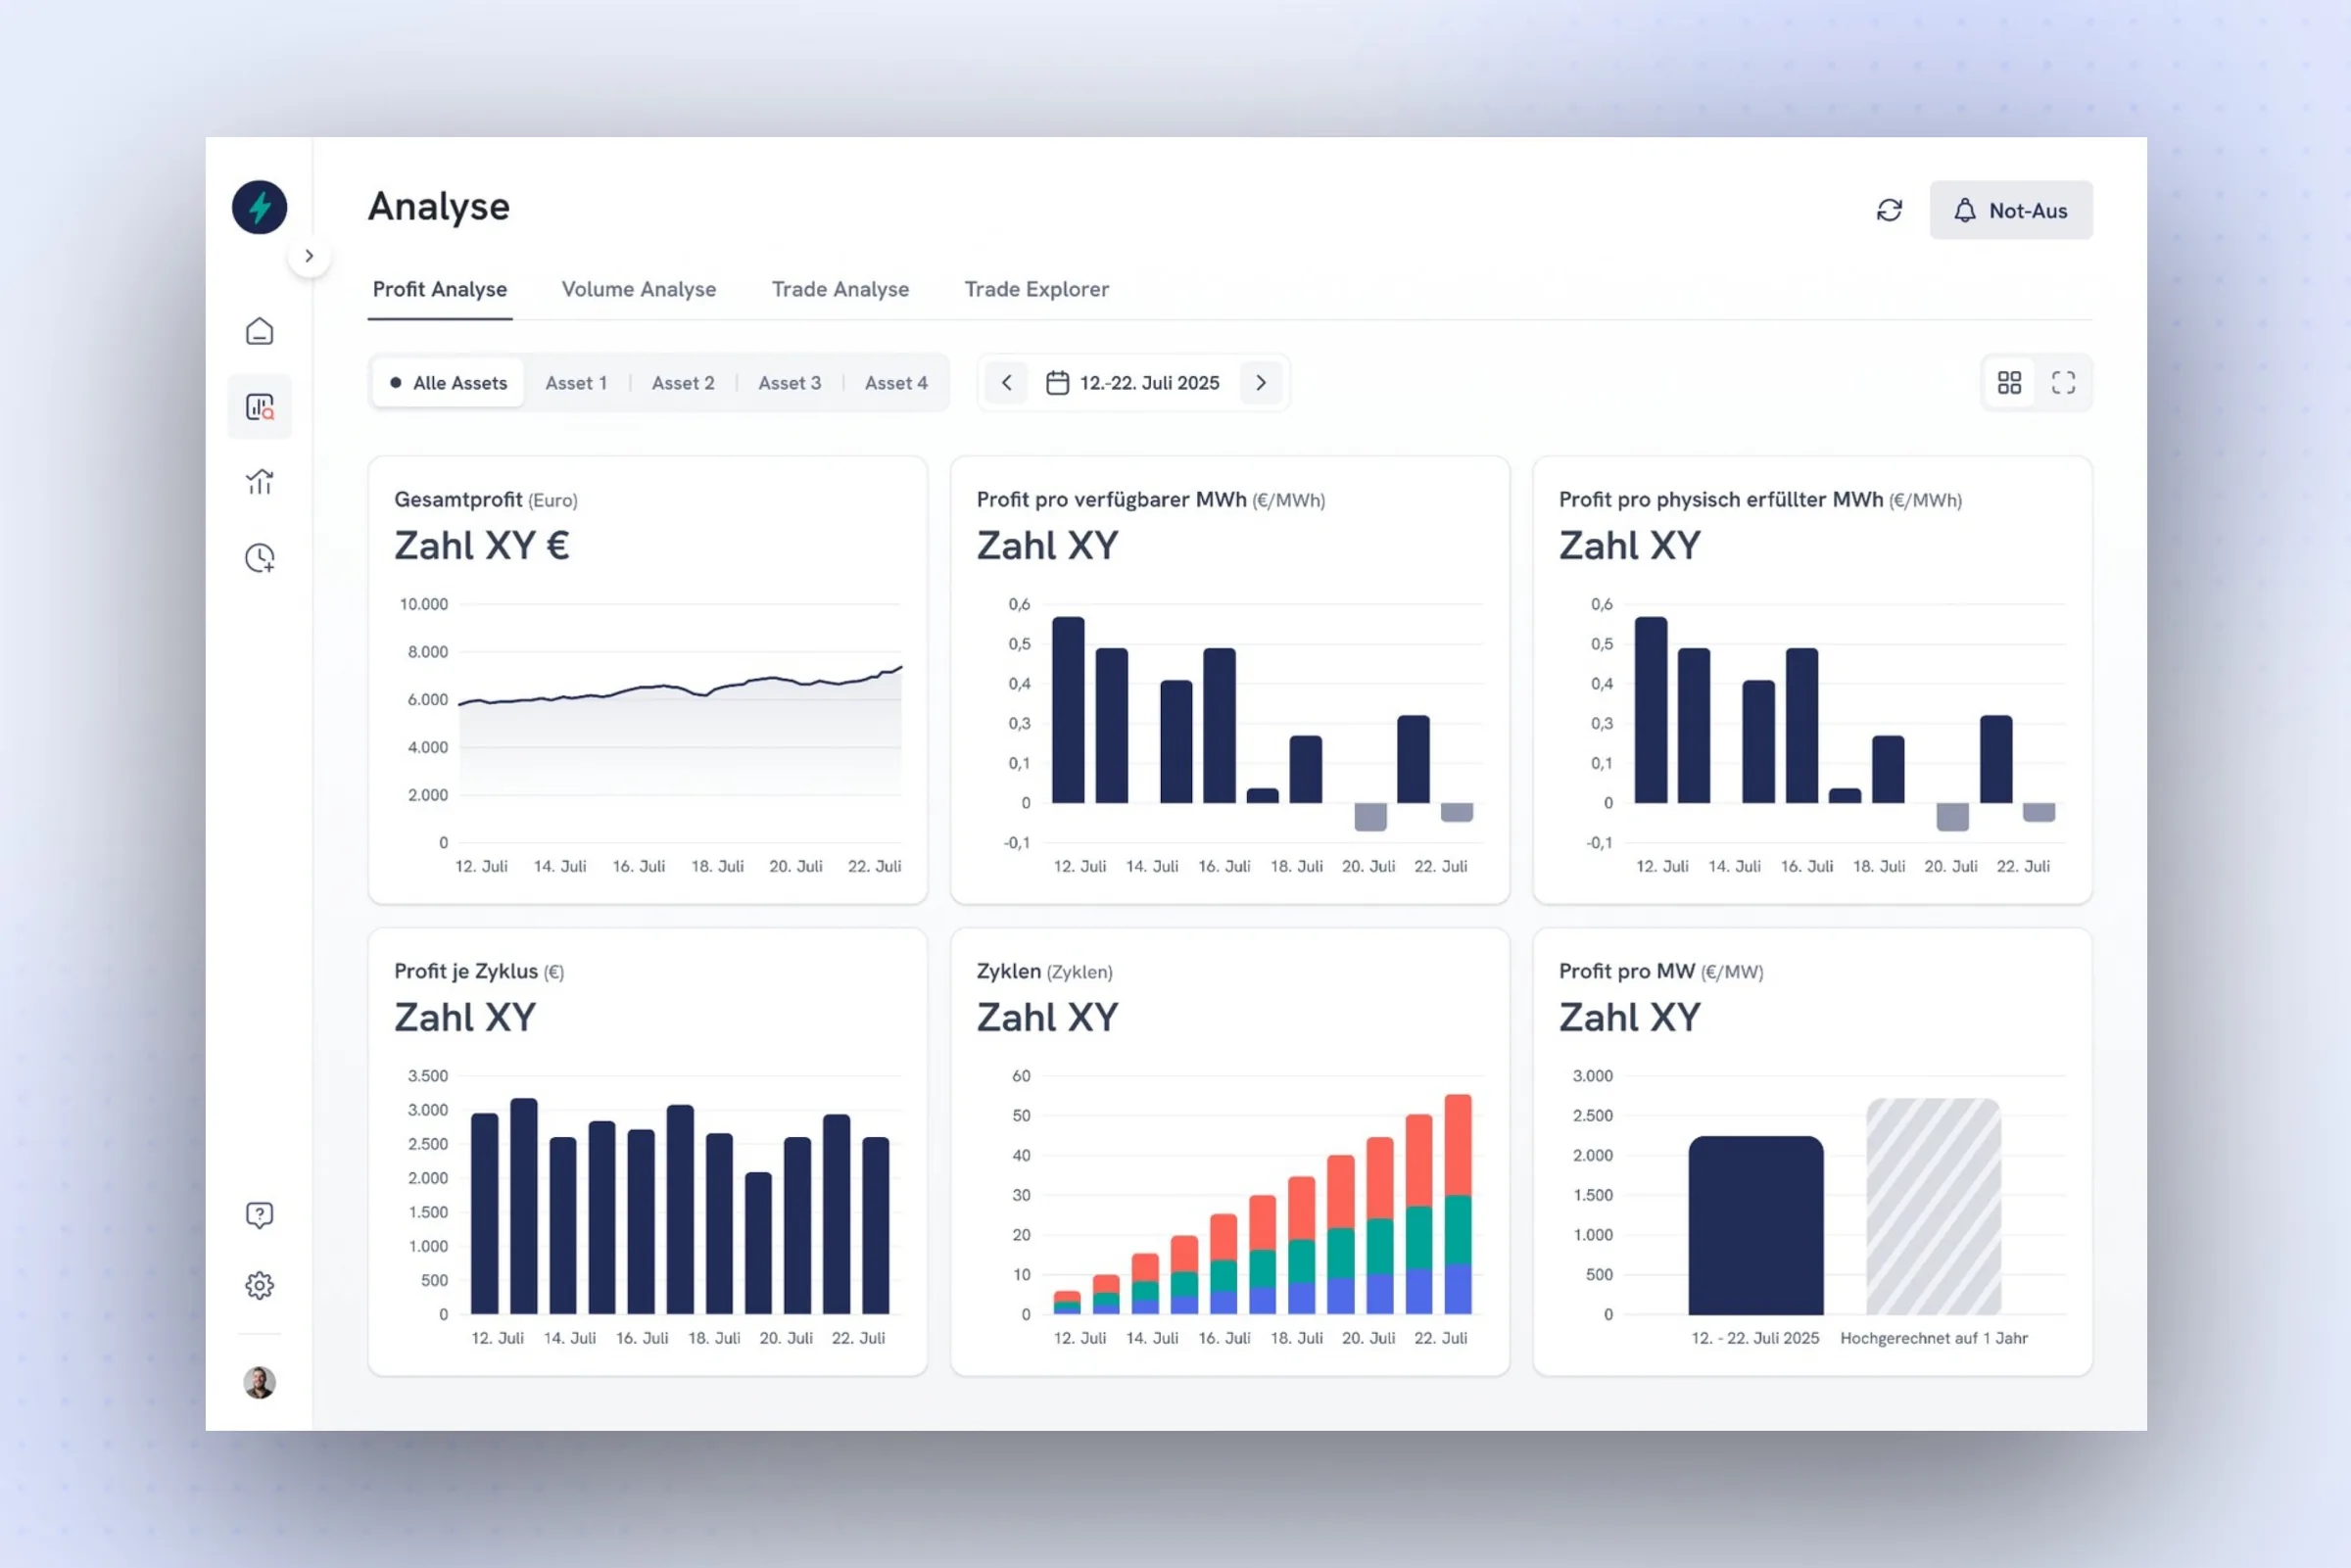
- Dashboard with the relevant KPIs per asset
- Responsive charts for intuitive queries
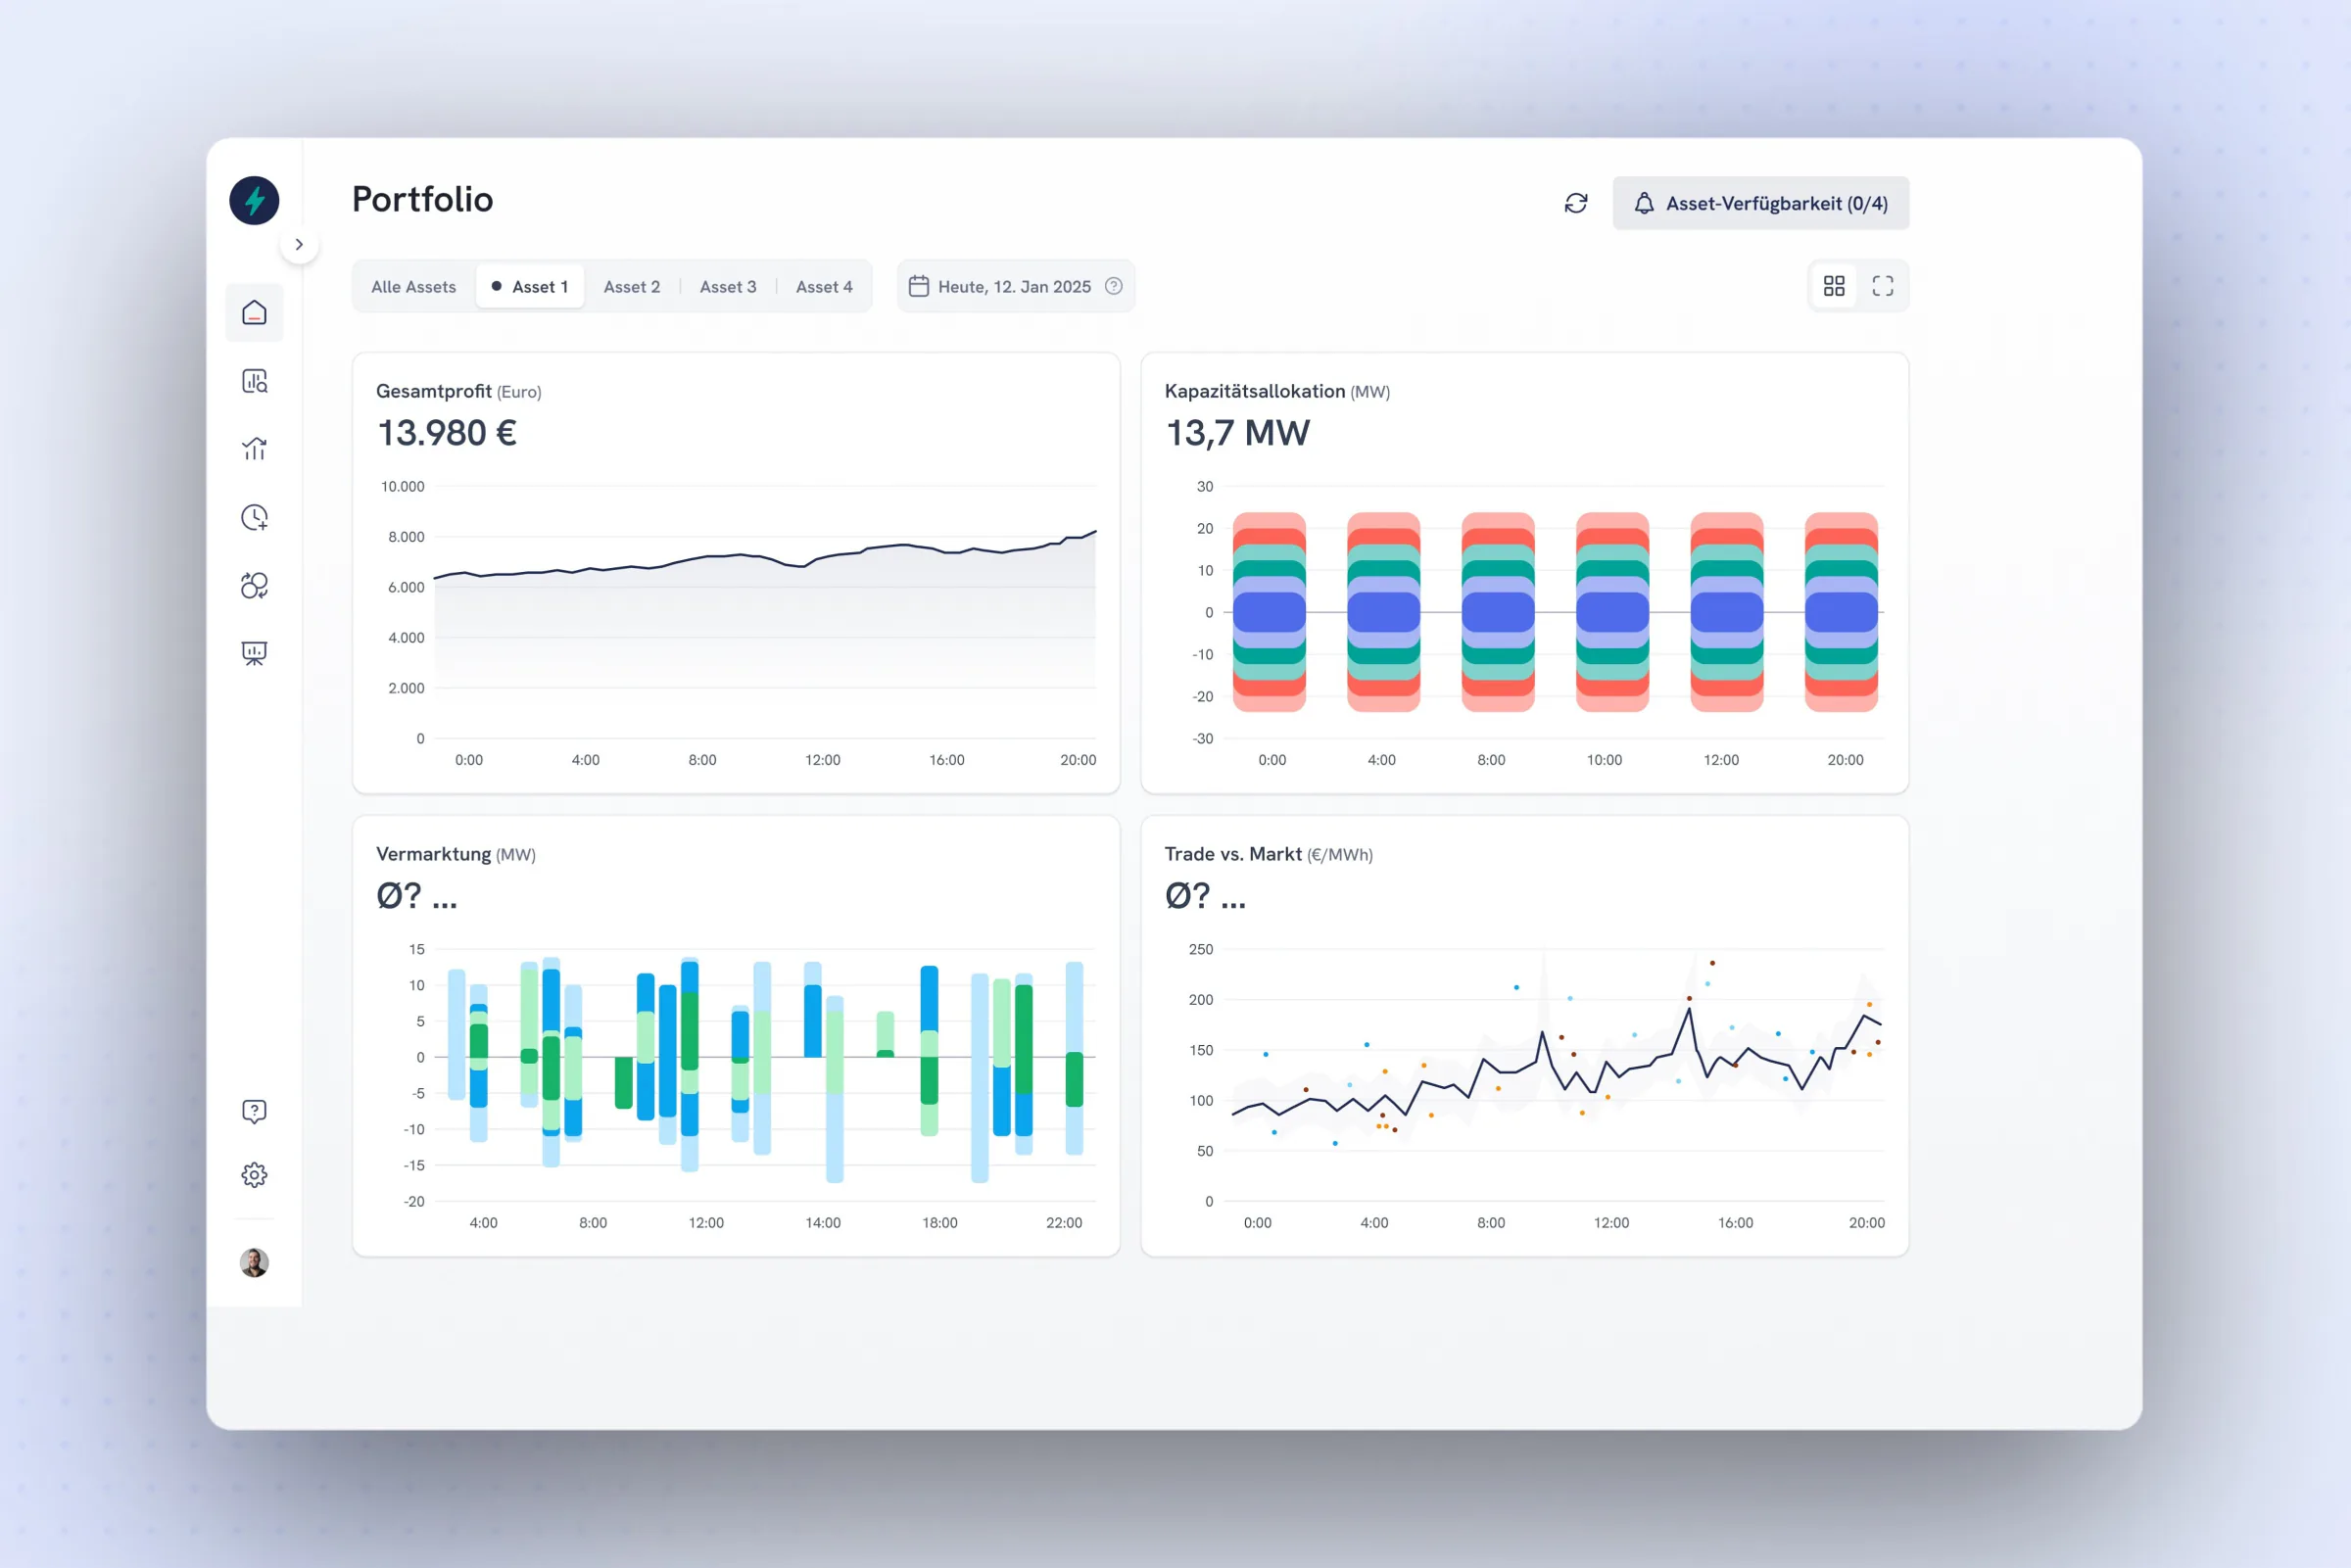
UI · Data visualisation Performance through design
An interface that keeps pace with the speed of the market.
- Availability reports every 15 minutes
- Automatic handover to the trading systems
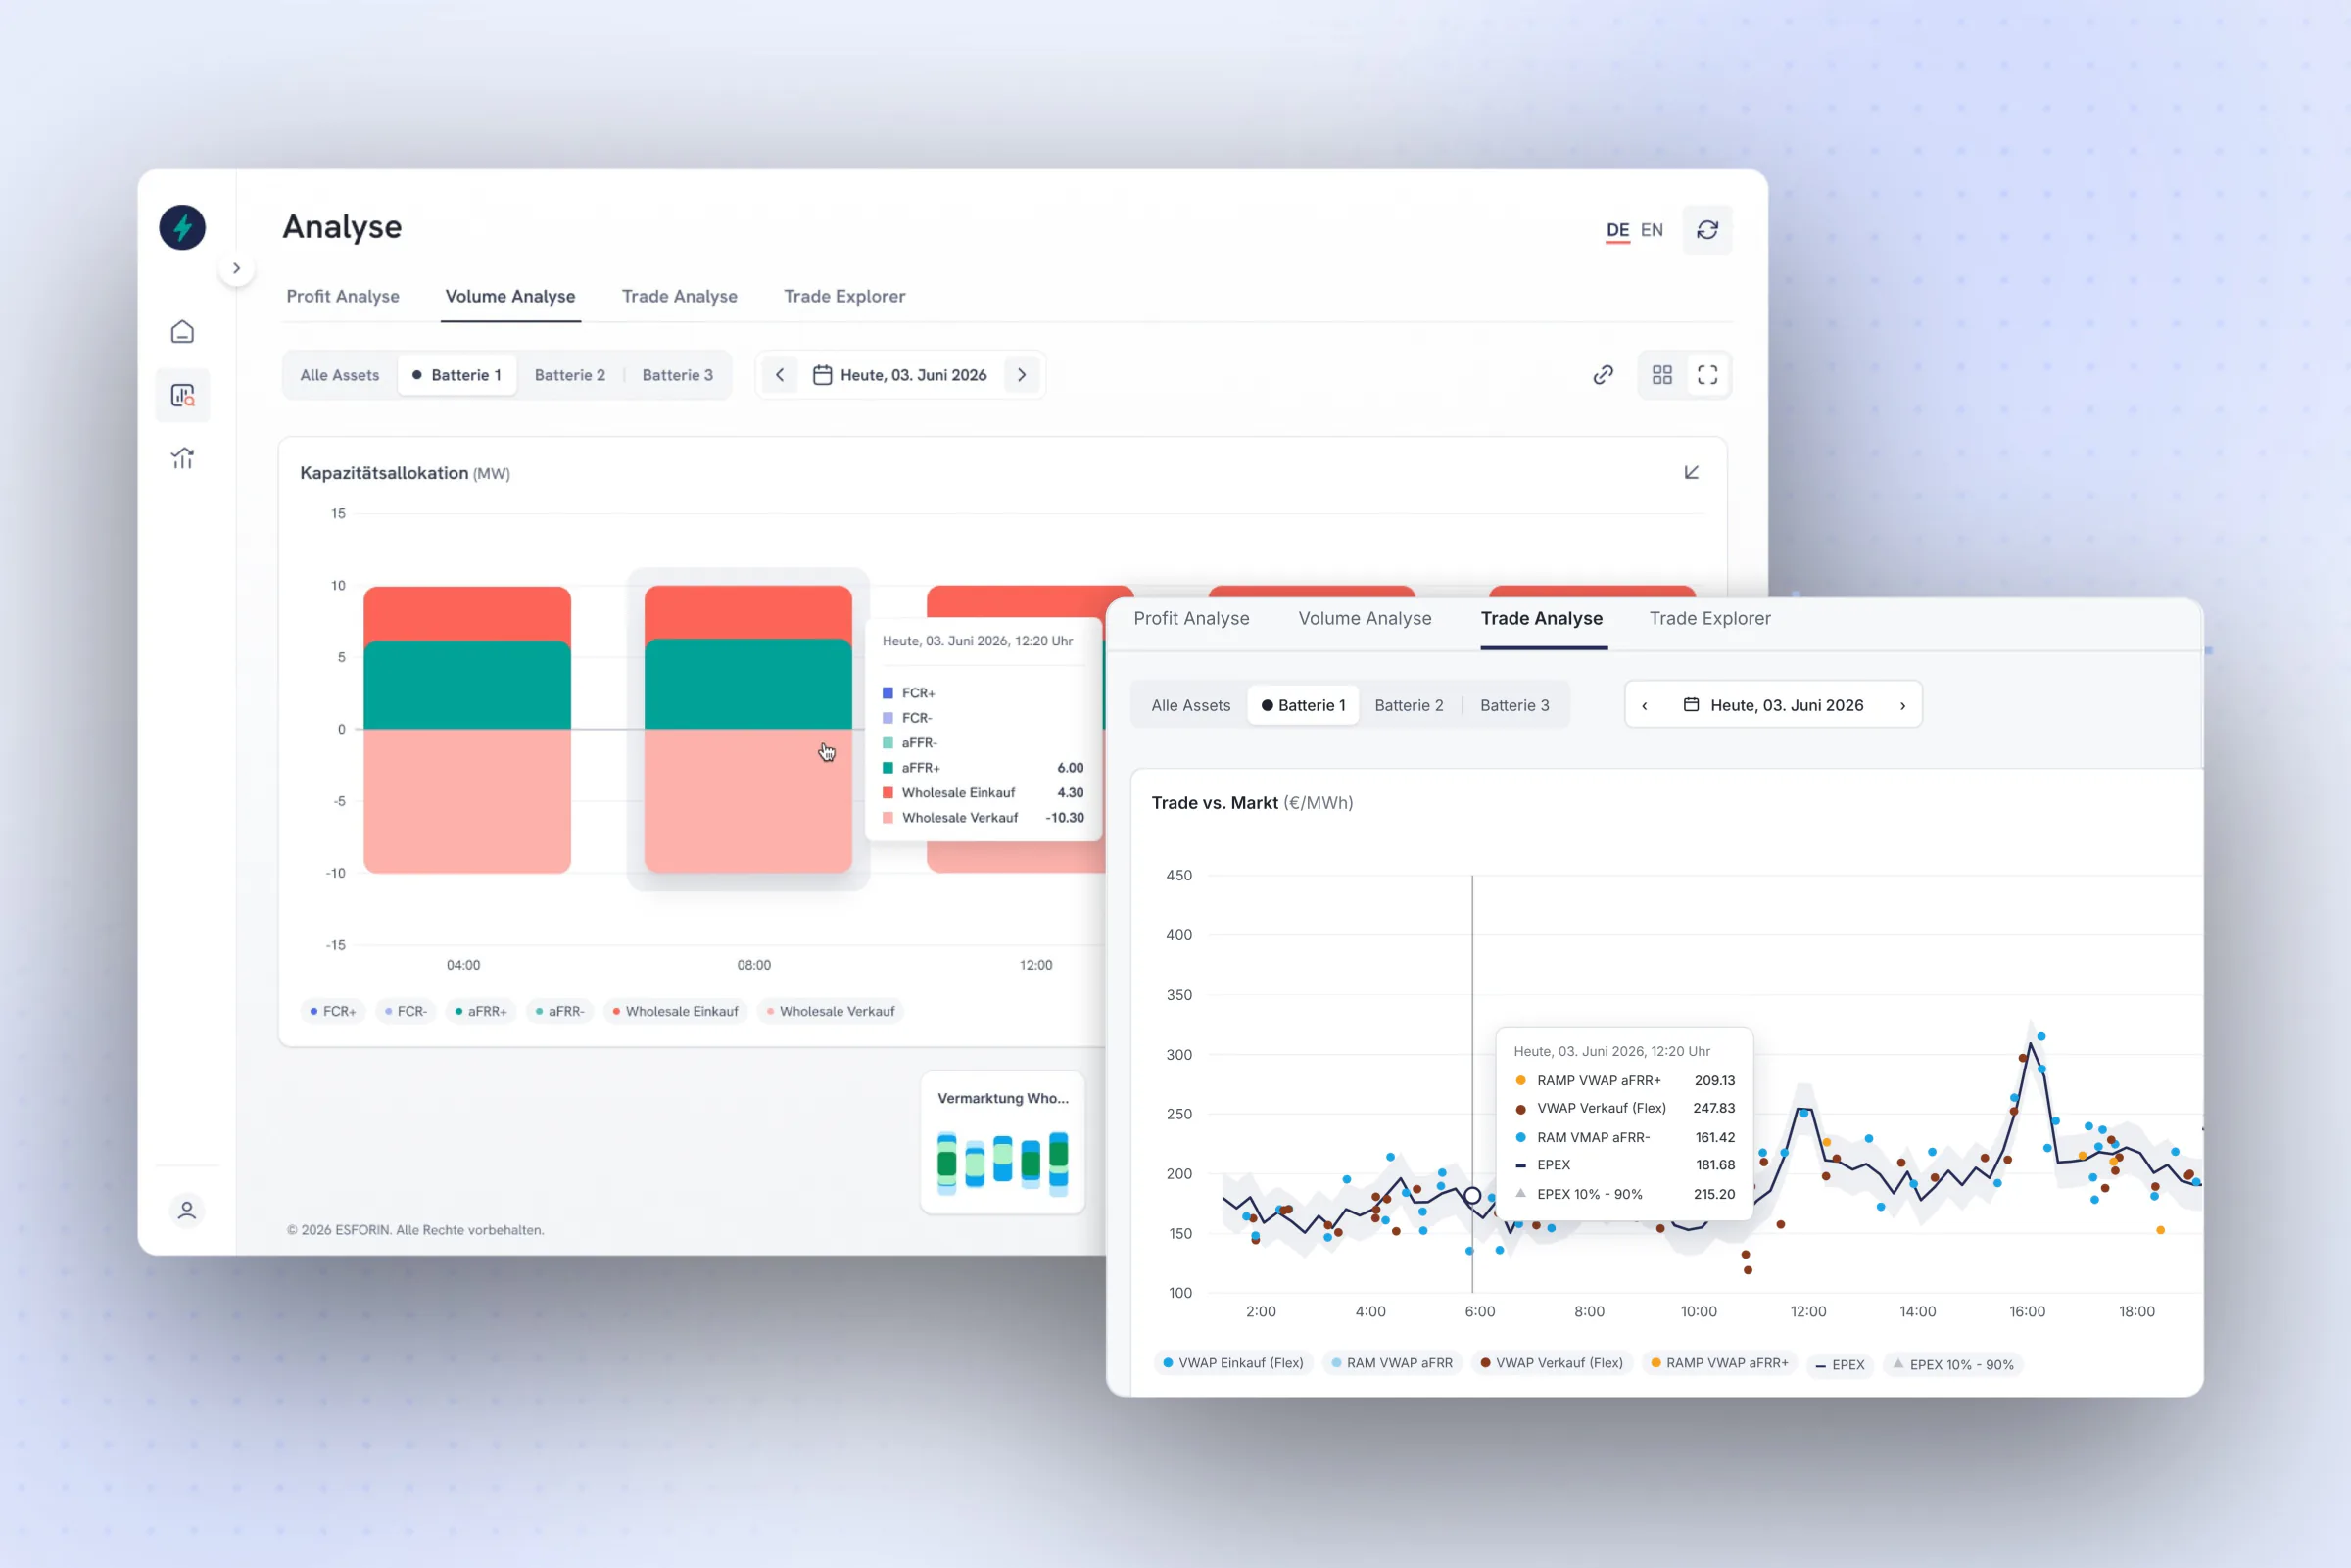
UX · Information architecture Complexity, intuitively bundled
Power and gas markets in one central system, transparent per portfolio.
- Total, per market segment or financial vs. physical
- More KPIs as mini charts below the main chart
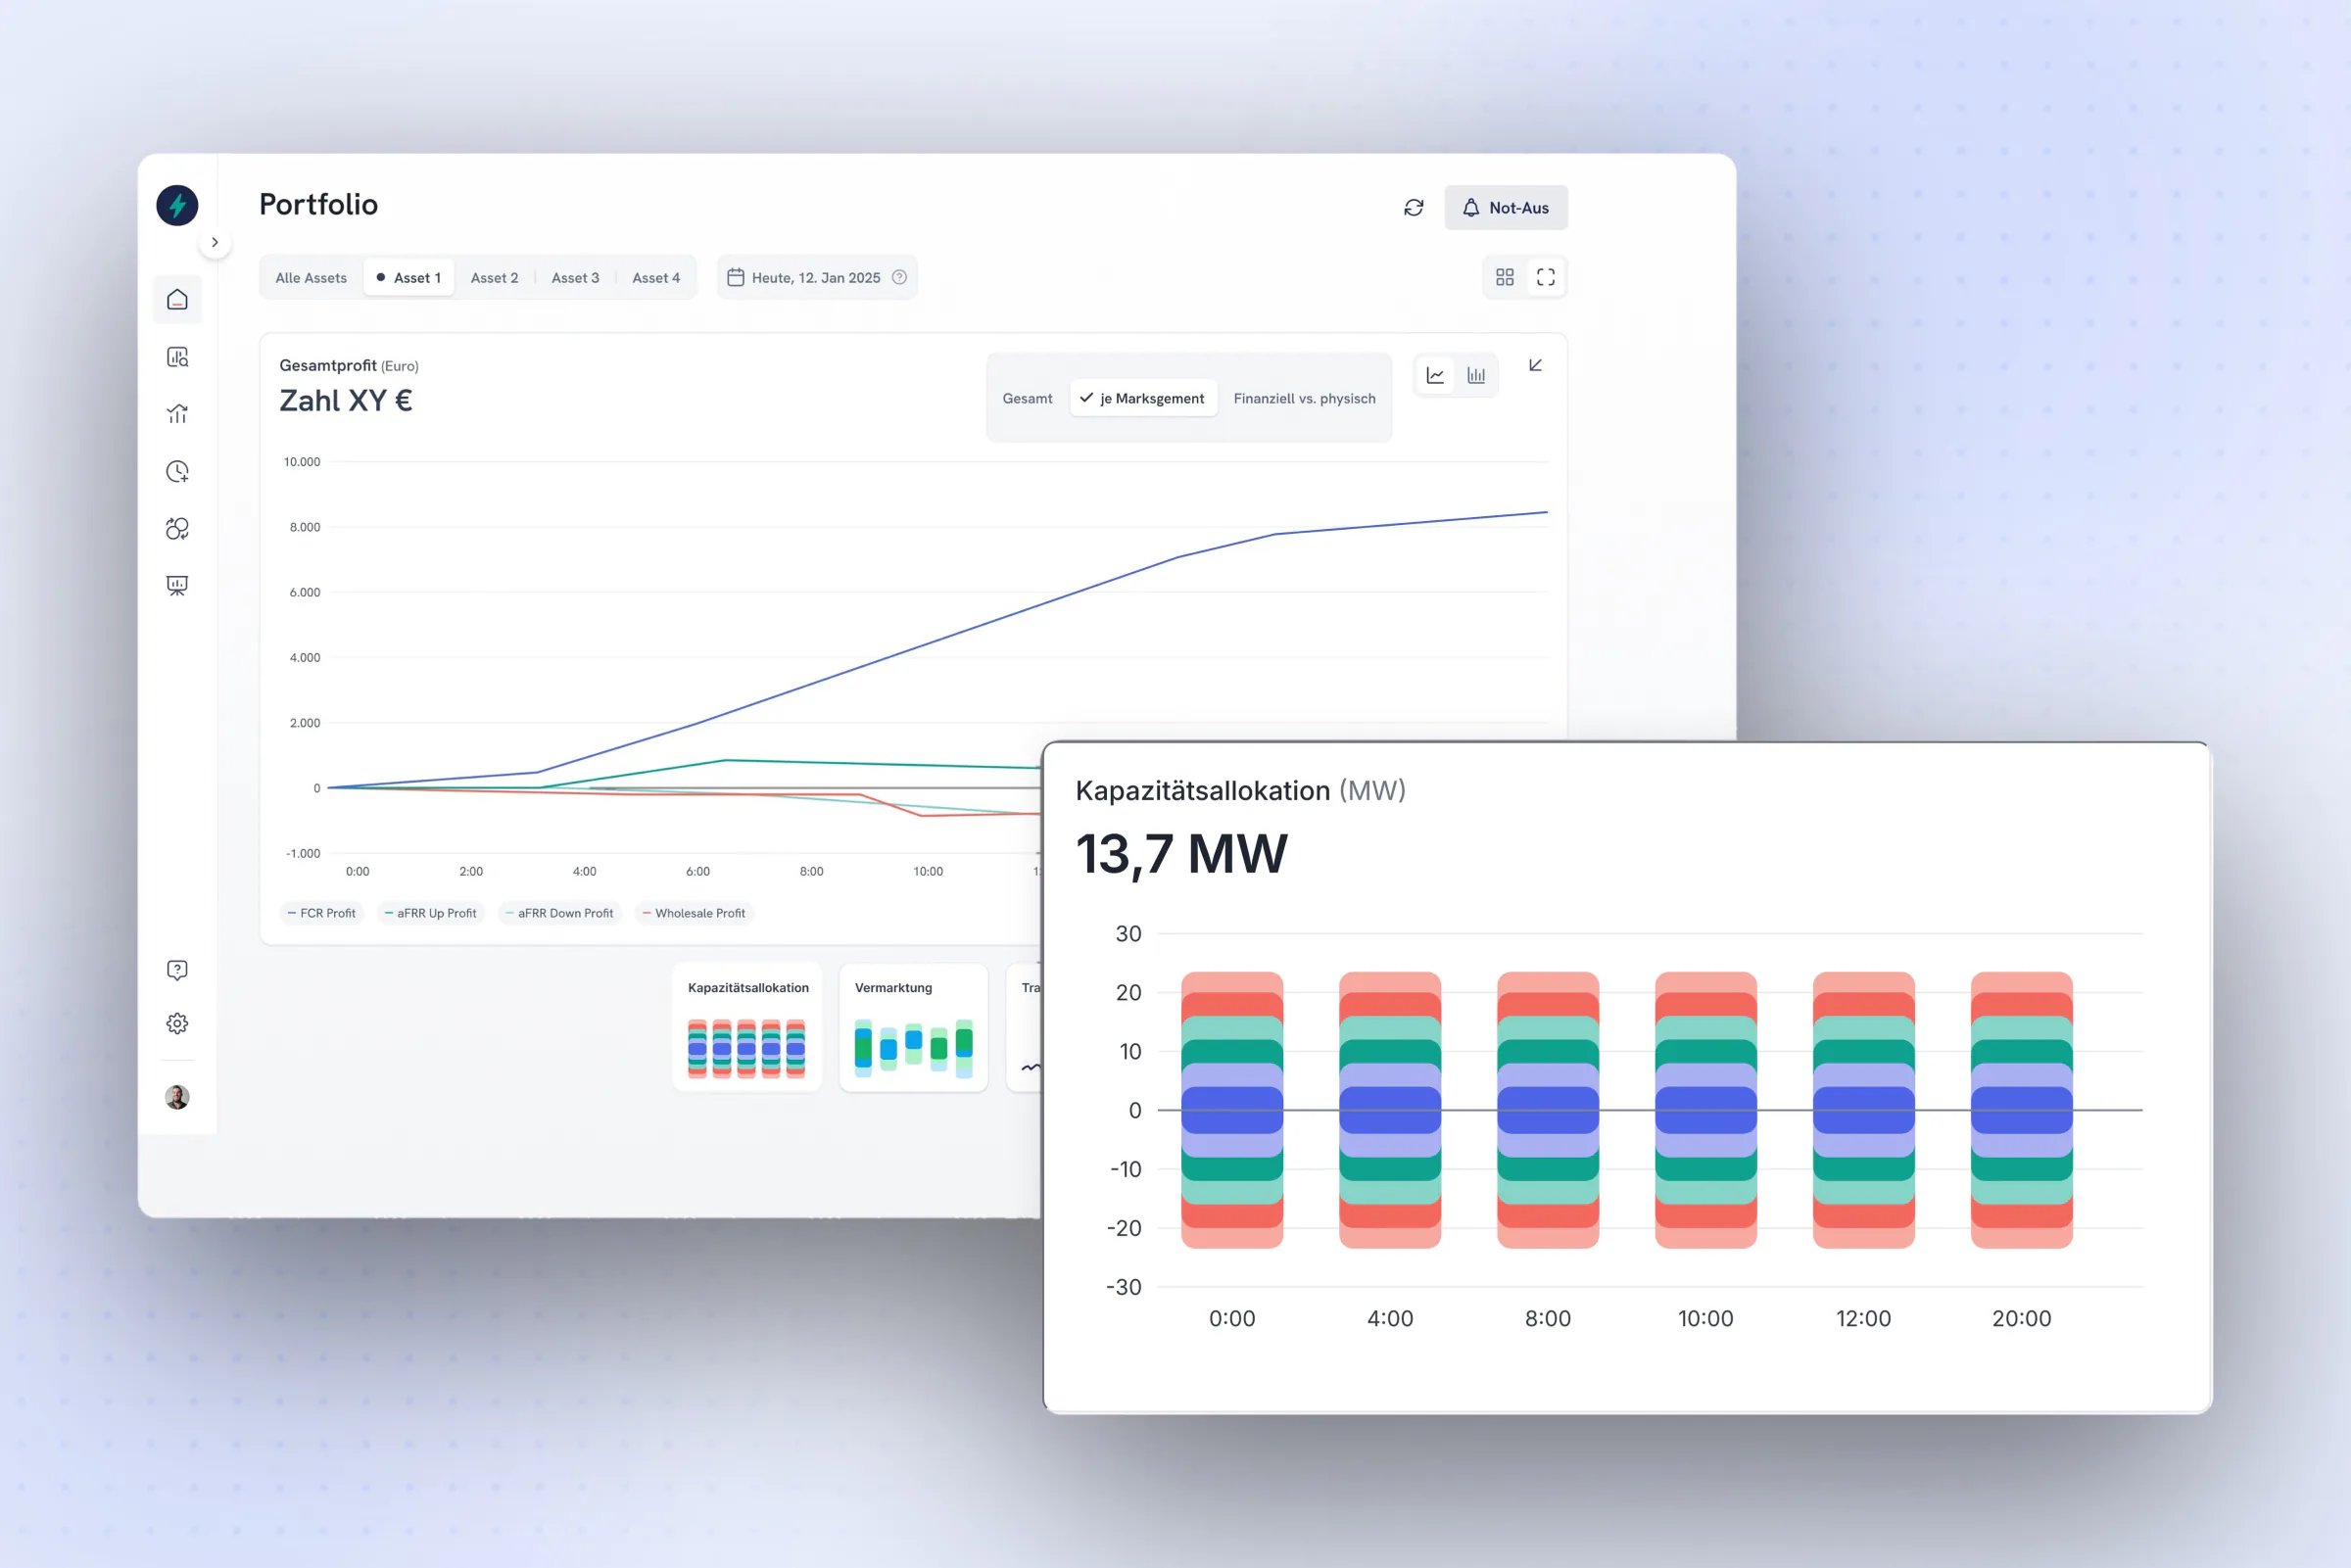
UI · Analysis Figures that carry decisions
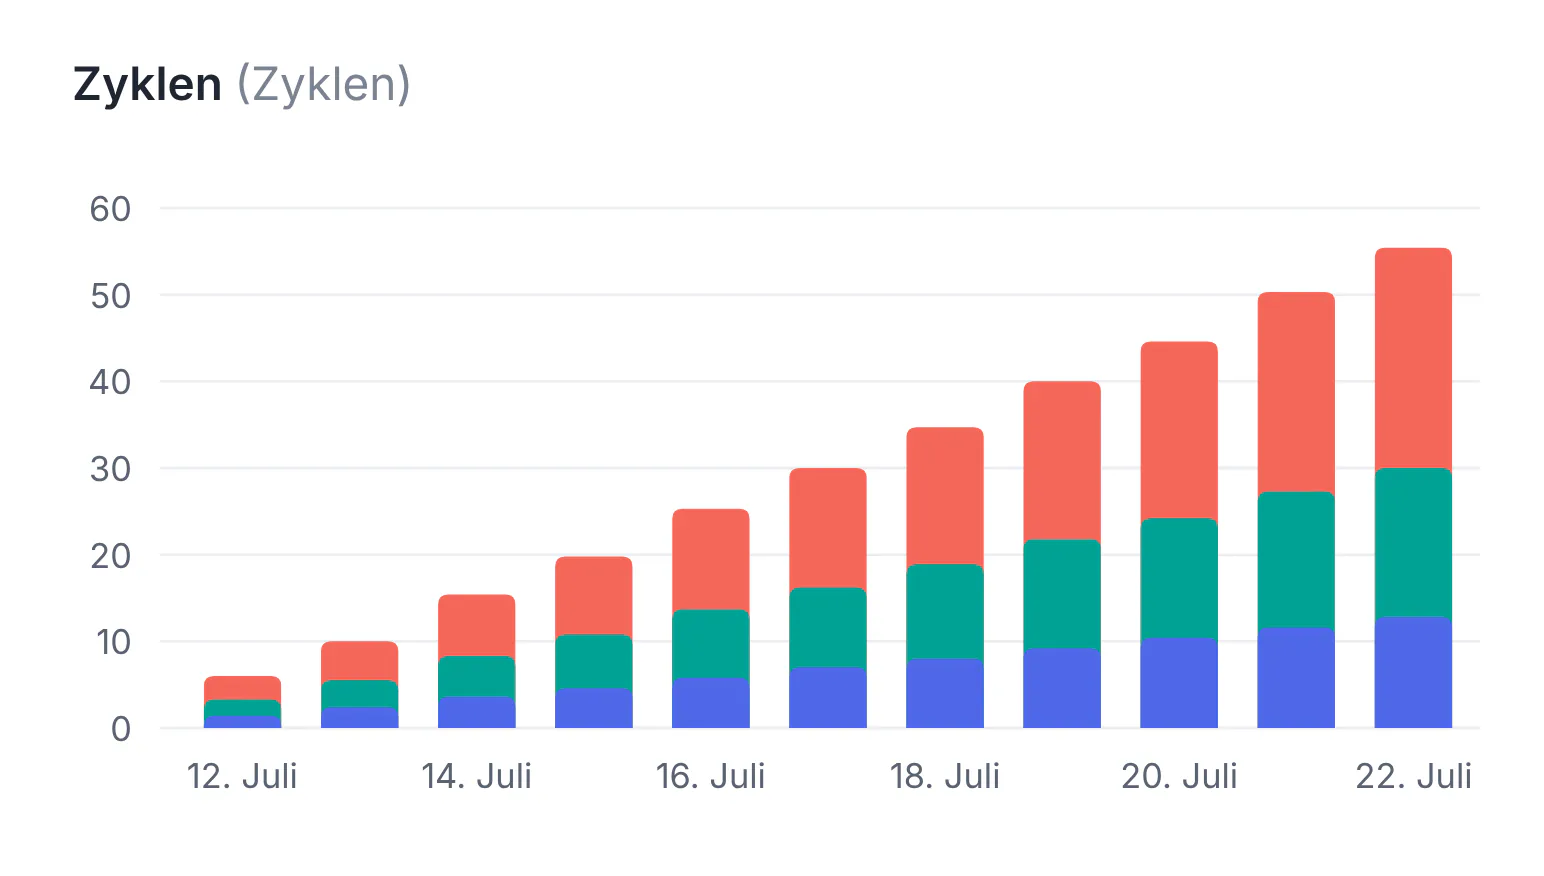
Revenues and asset-specific figures such as cycles become visible.
- Charging cycles of battery storage over time
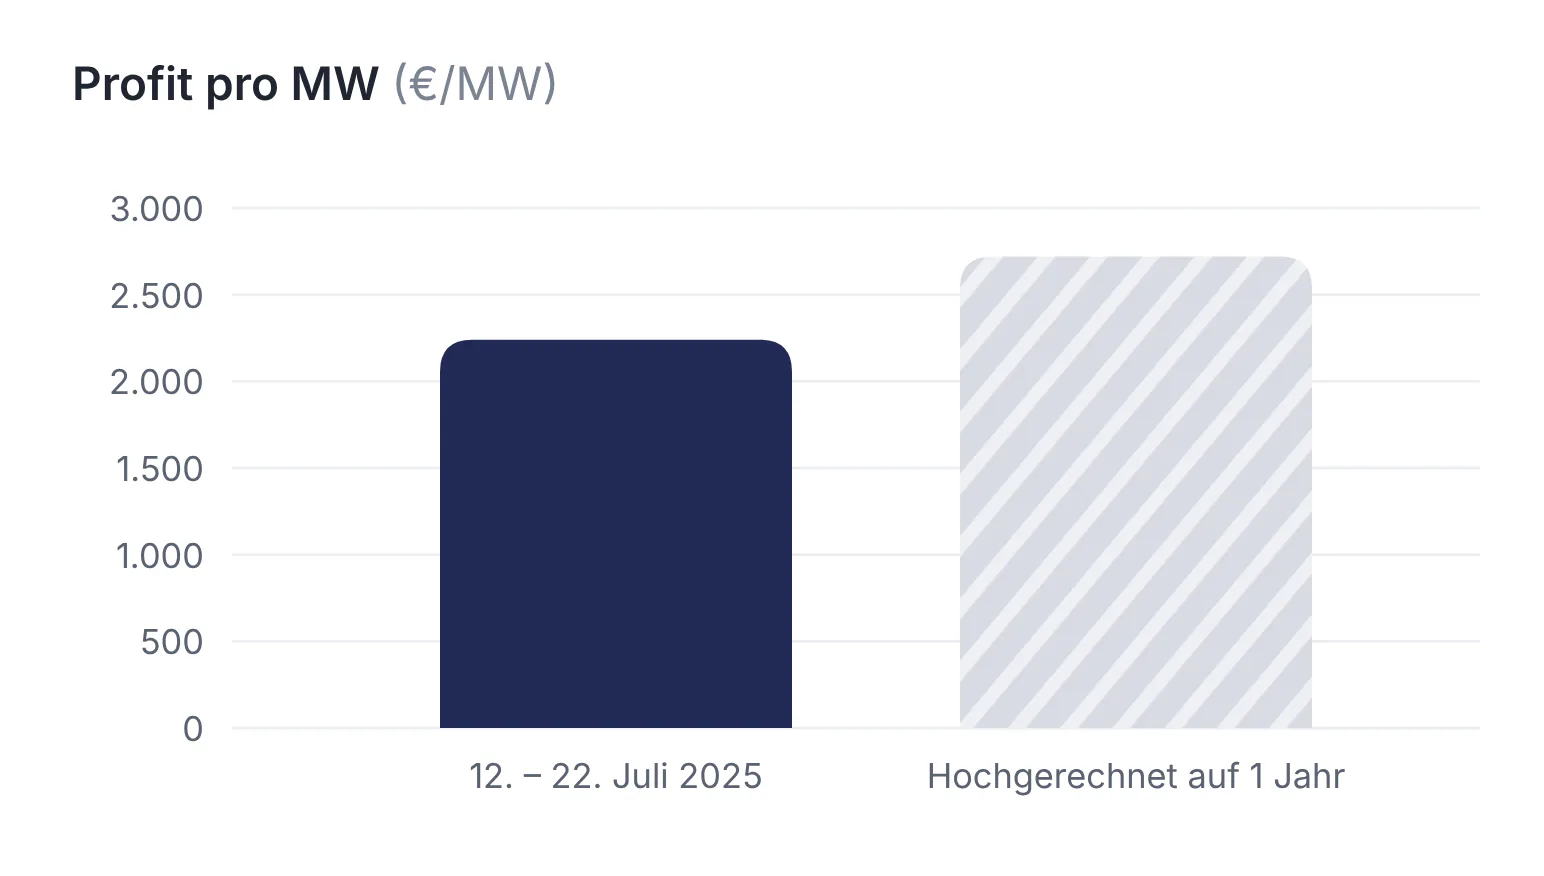
- Profit per MW, projected to a full year
From the asset to the market
Availability every 15 minutes, handed over to the trading systems automatically.
The interface in detail
Clear data colours on a calm navy, key features in focus.
Profit analysis
Total profit and KPIs at a glance


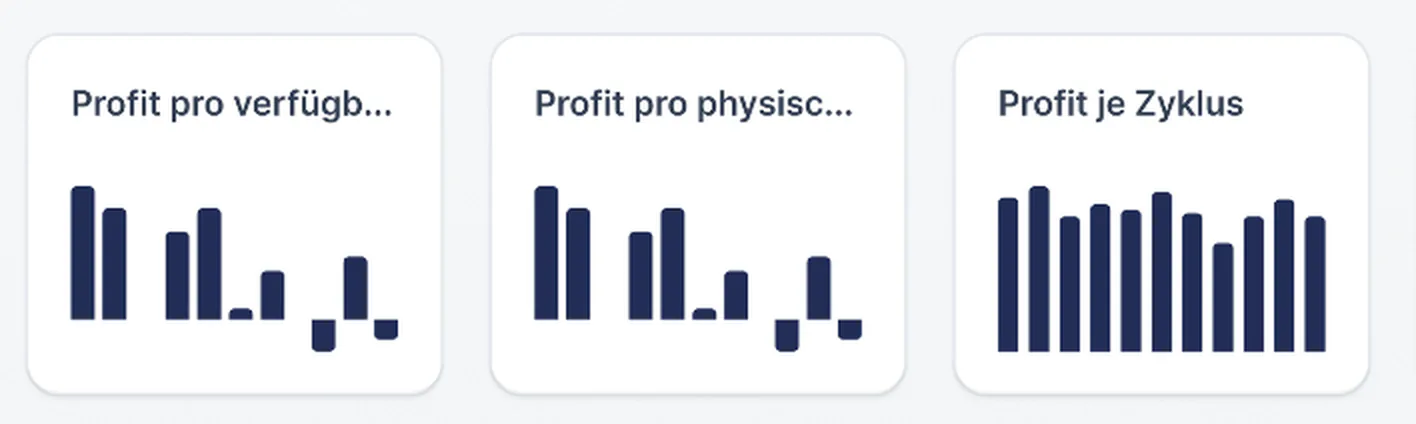
KPI grid
Revenues and asset figures
10years+
of ESFORIN working with its customers
20types+
of assets, from battery storage to industrial plants
15min
interval of the availability reports
“Working with inovex was real added value for us.”