

Case study · SMIGHT IQ Copilot
The power grid under pressure
Smart grid meets user experience: with SMIGHT we created an interface that lets grid operators spot load peaks and safely dim controllable consumers.
- Client
- SMIGHT GmbH
Subsidiary of EnBW AG - Services
- UI/UX · User research
Apps · Data science
Embedded systems - Project period
- since 2024
- Technologies
- Angular · Kotlin
Kubernetes · Azure
Docker
A new law.
A new way to run the grid.
Since 2024, grid operators may dim heat pumps and wallboxes under §14a EnWG when an overload looms. The SMIGHT IQ Copilot makes this safe and easy to control, using measurements from the local substation.
Three reasons why the Copilot works in grid operations
Our UX and UI decisions at a glance.
UX · Research User insights for the energy transition
User research, stakeholder interviews and shadowing in grid operations turned §14a EnWG from a bureaucratic monster into a digital opportunity.
- Design drawn from grid operators’ daily work
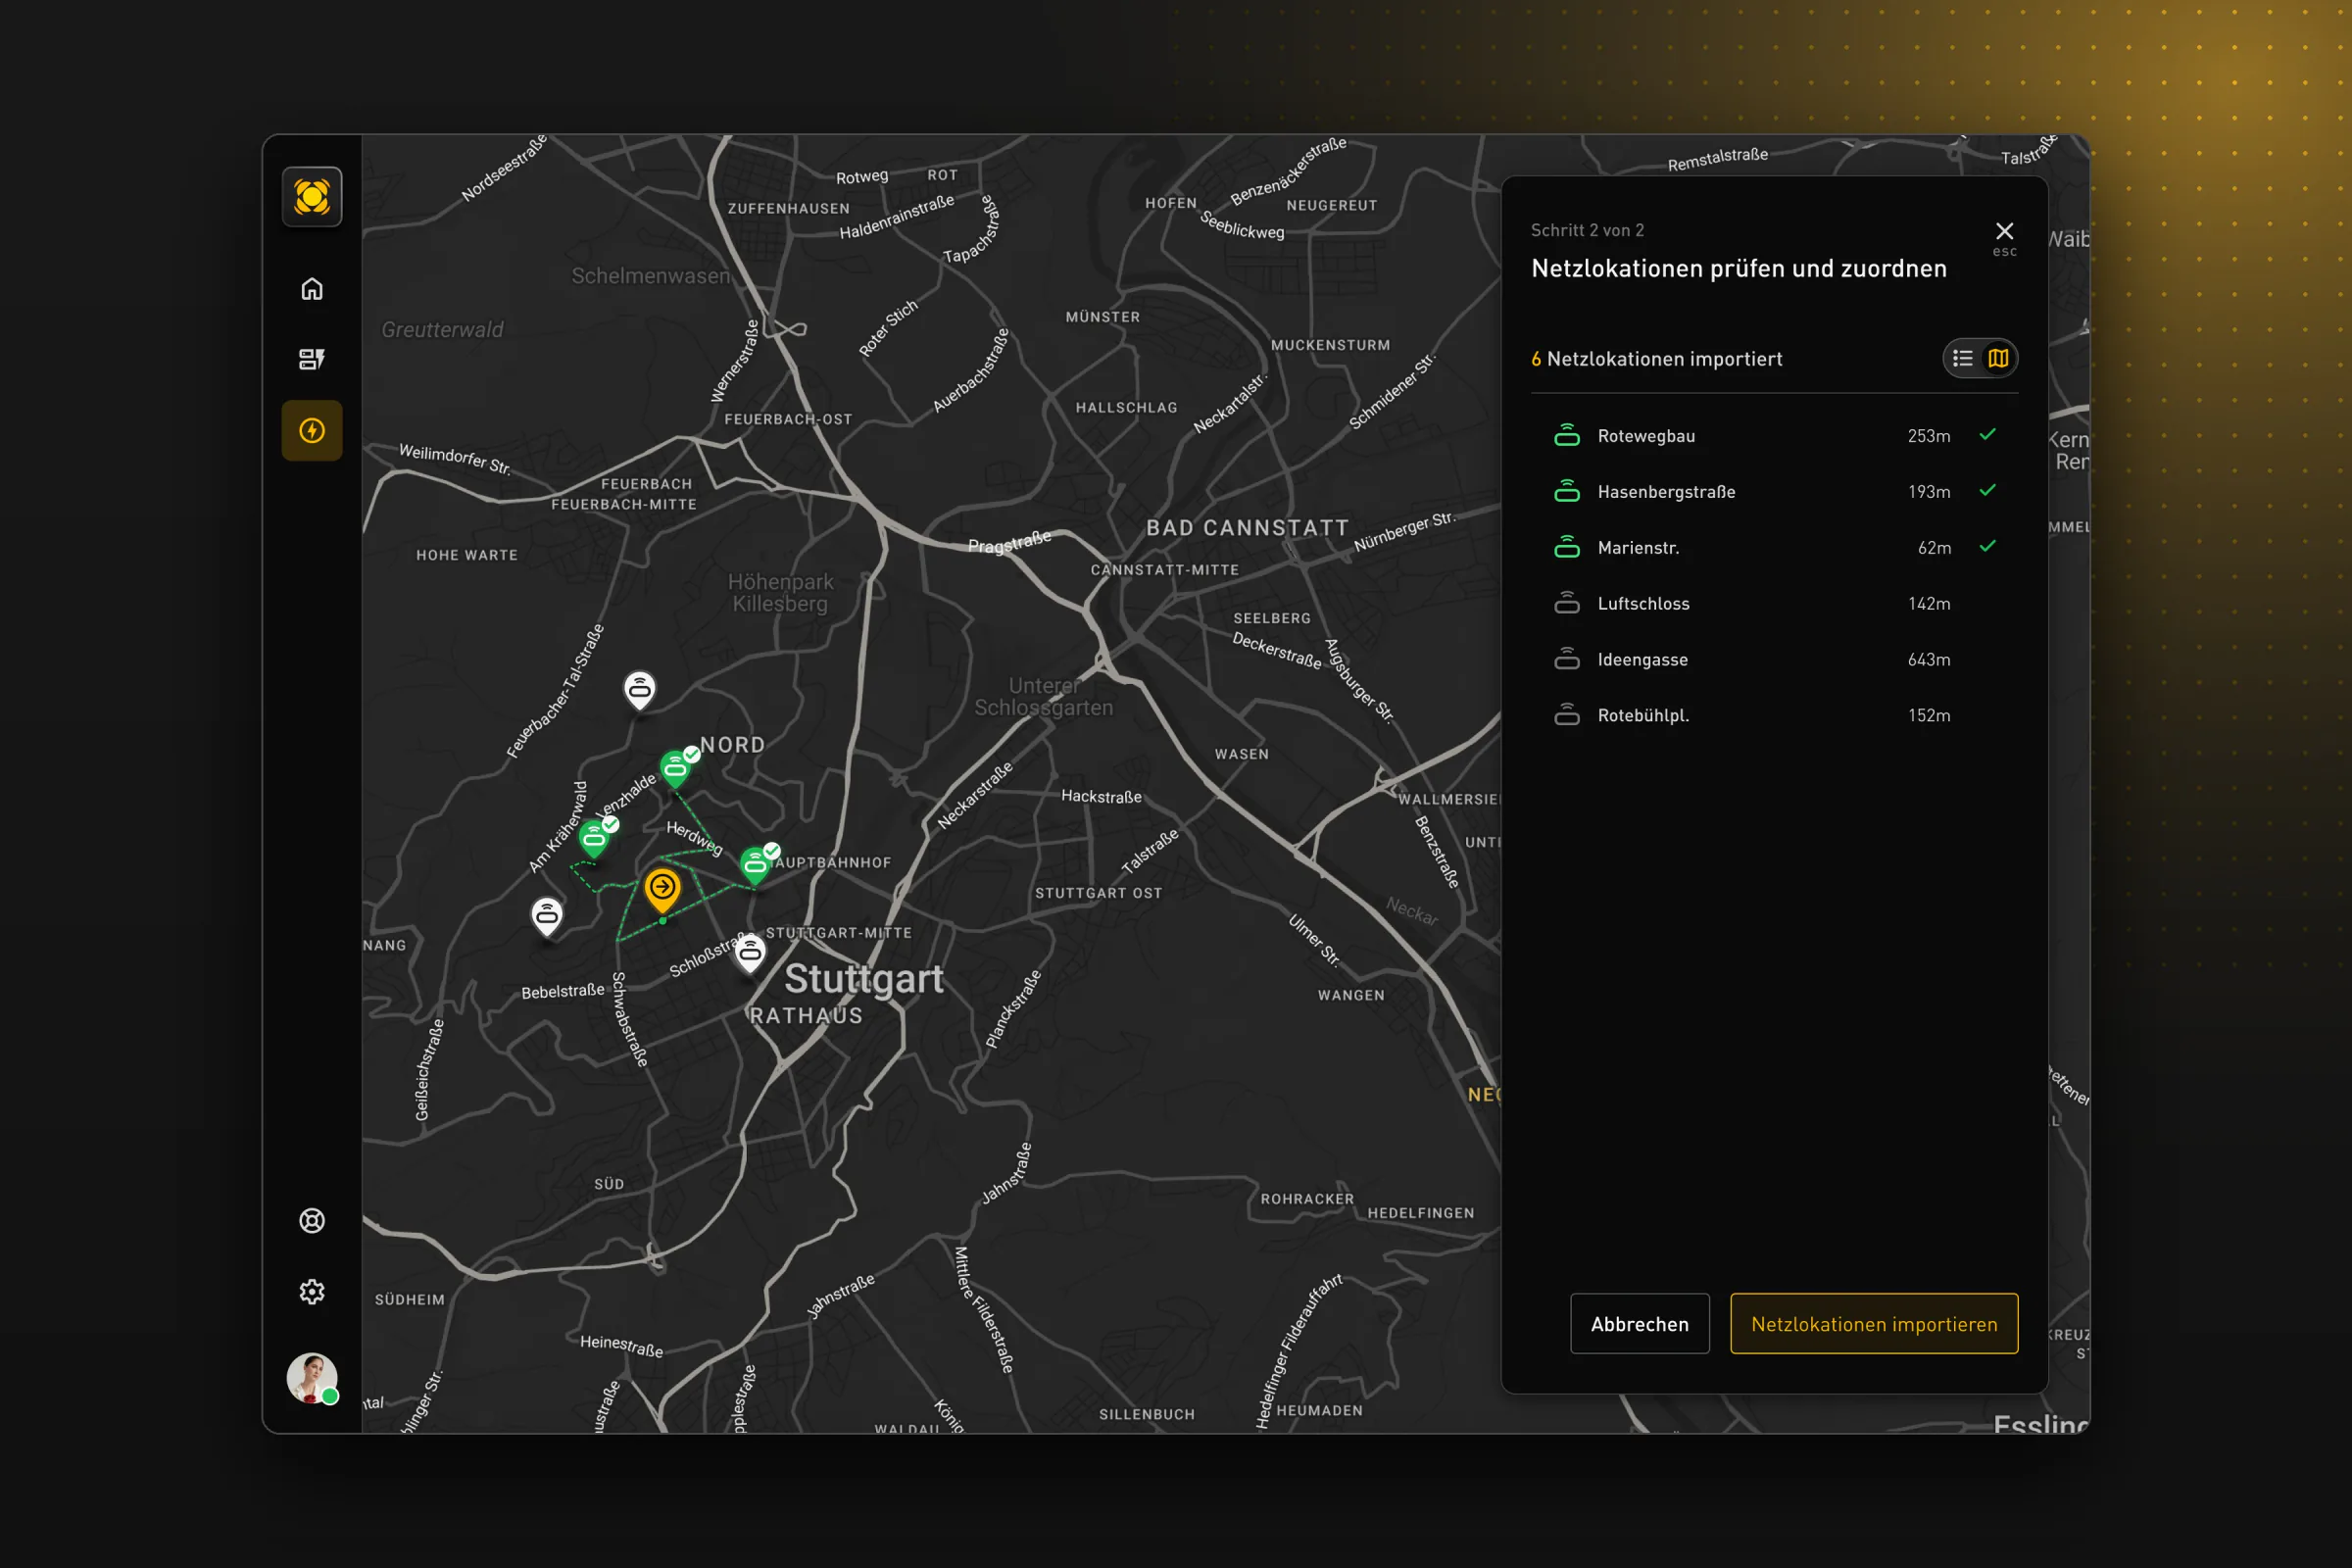
- Assign controllable devices to local substations on the map
UX · Interaction Resilient grids through UX
From measurement to action in seconds, with safe grid control at a tap.
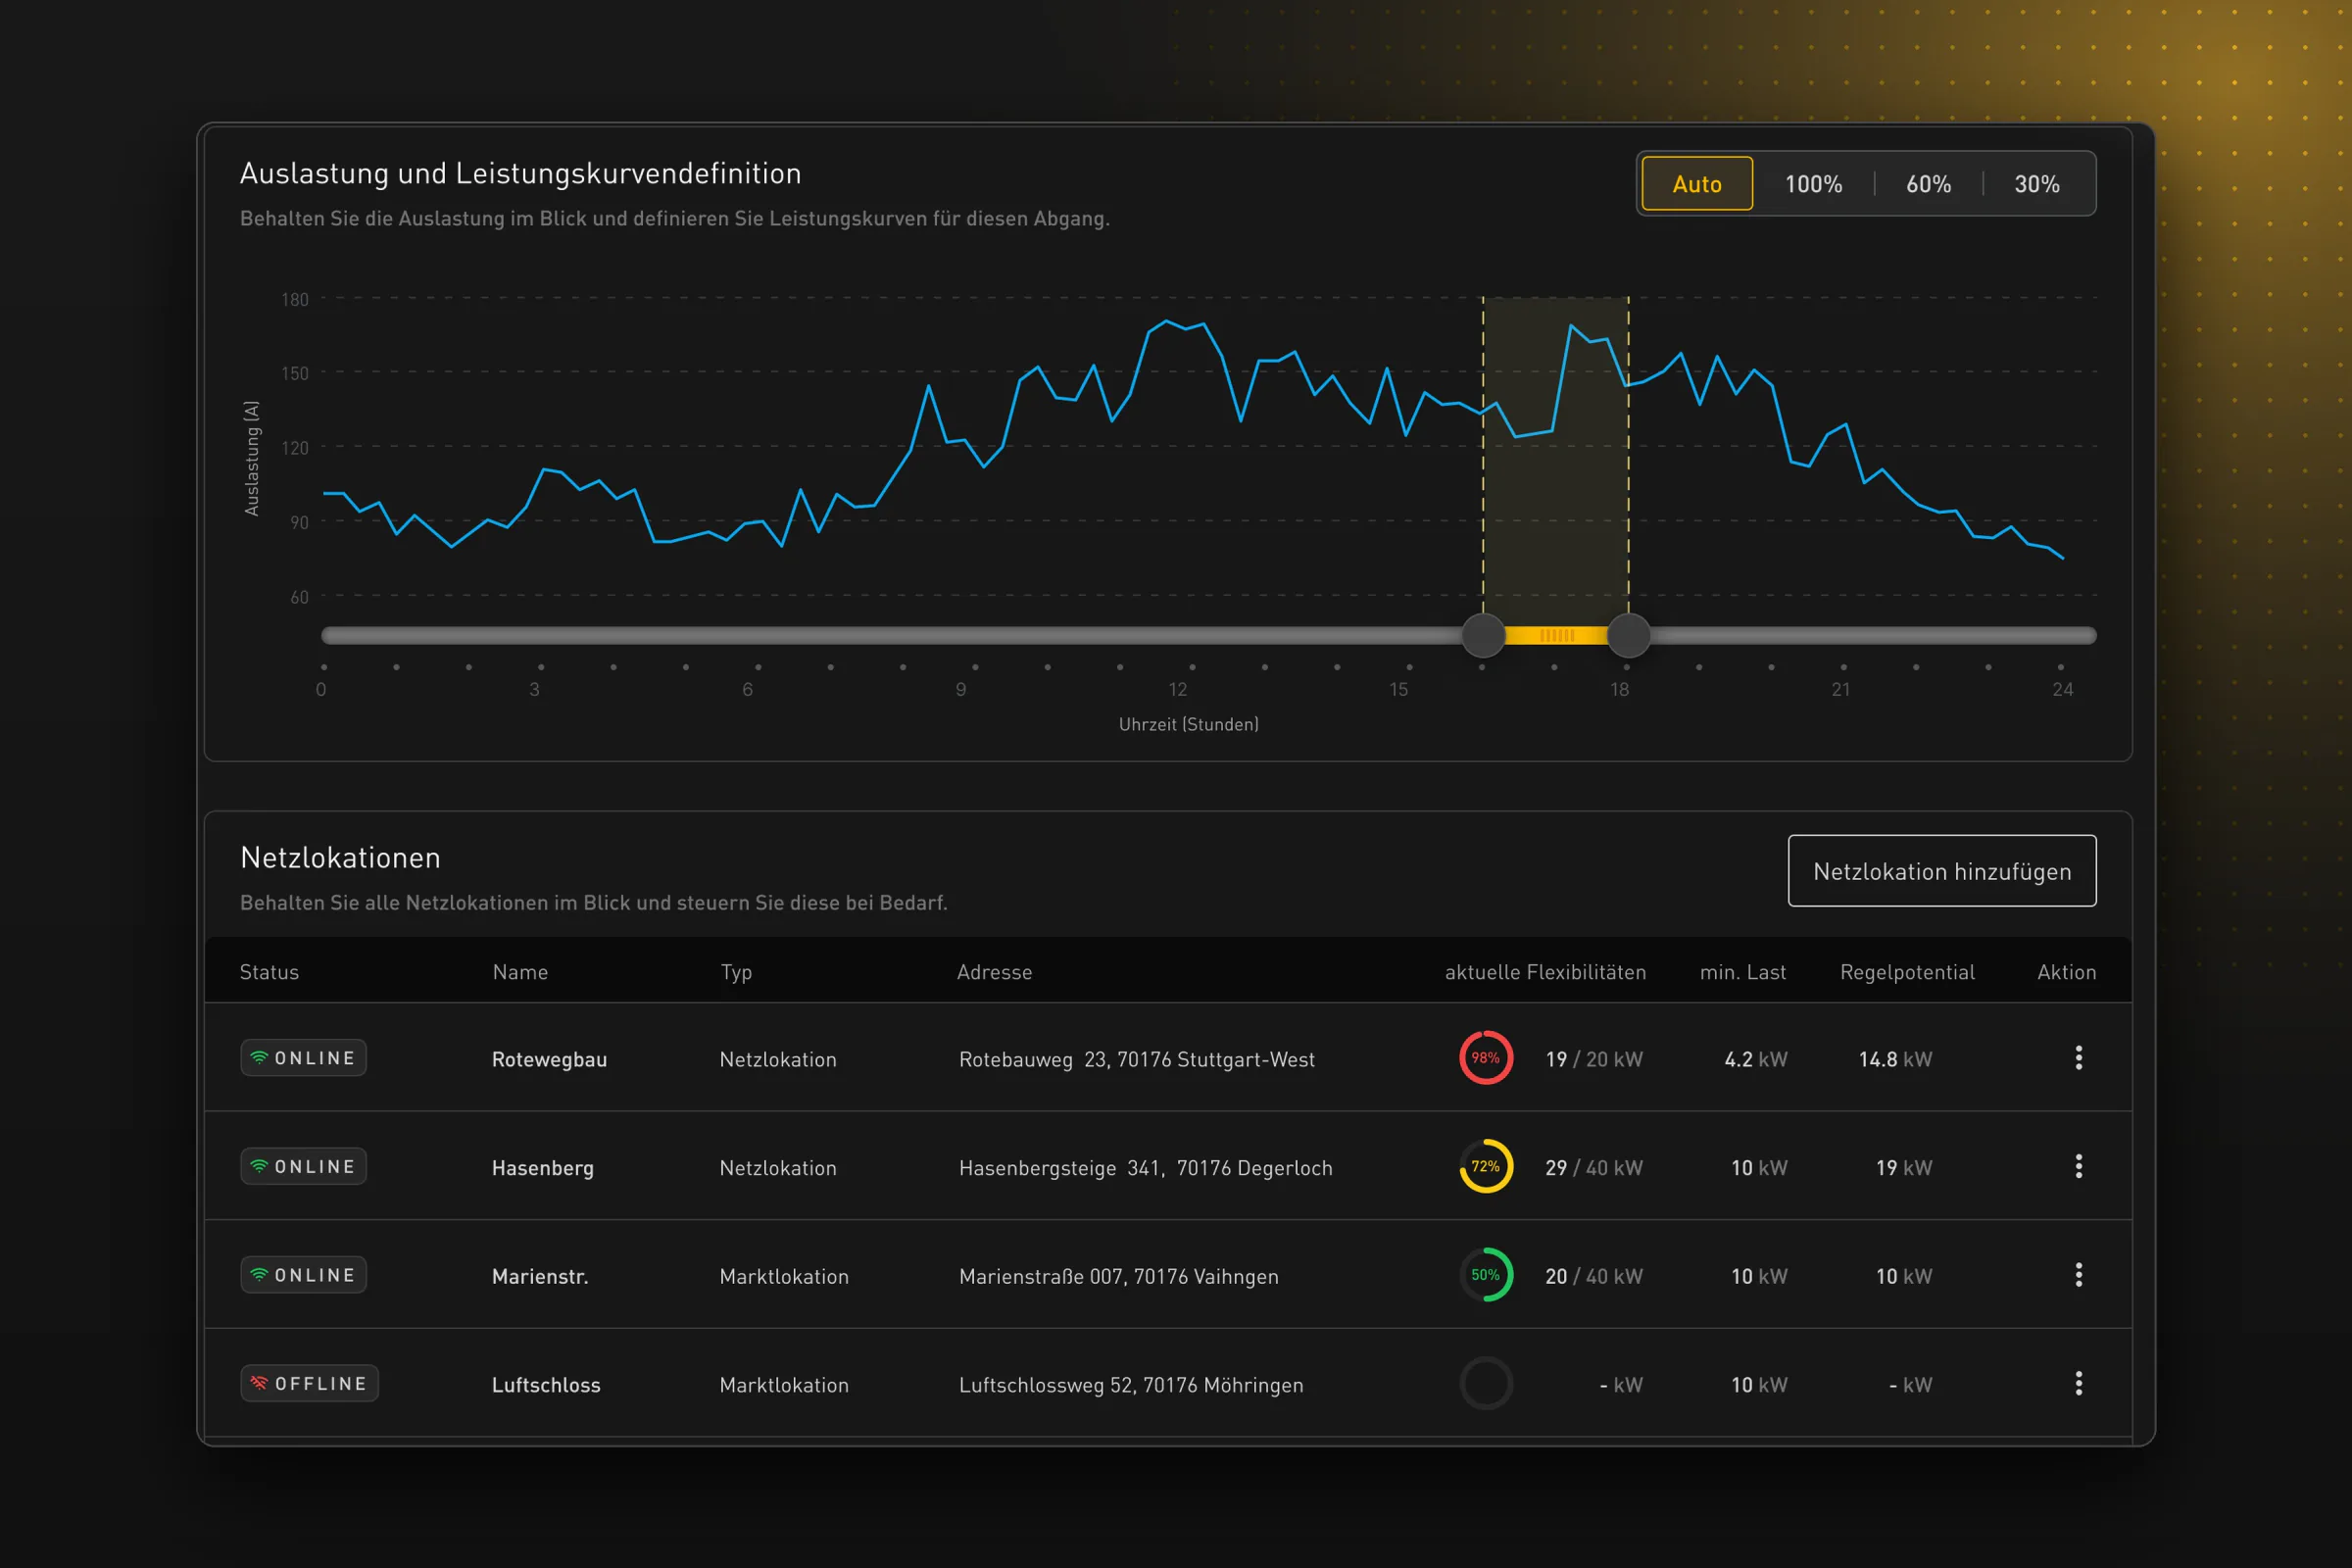
- Load per grid location as a traffic-light ring
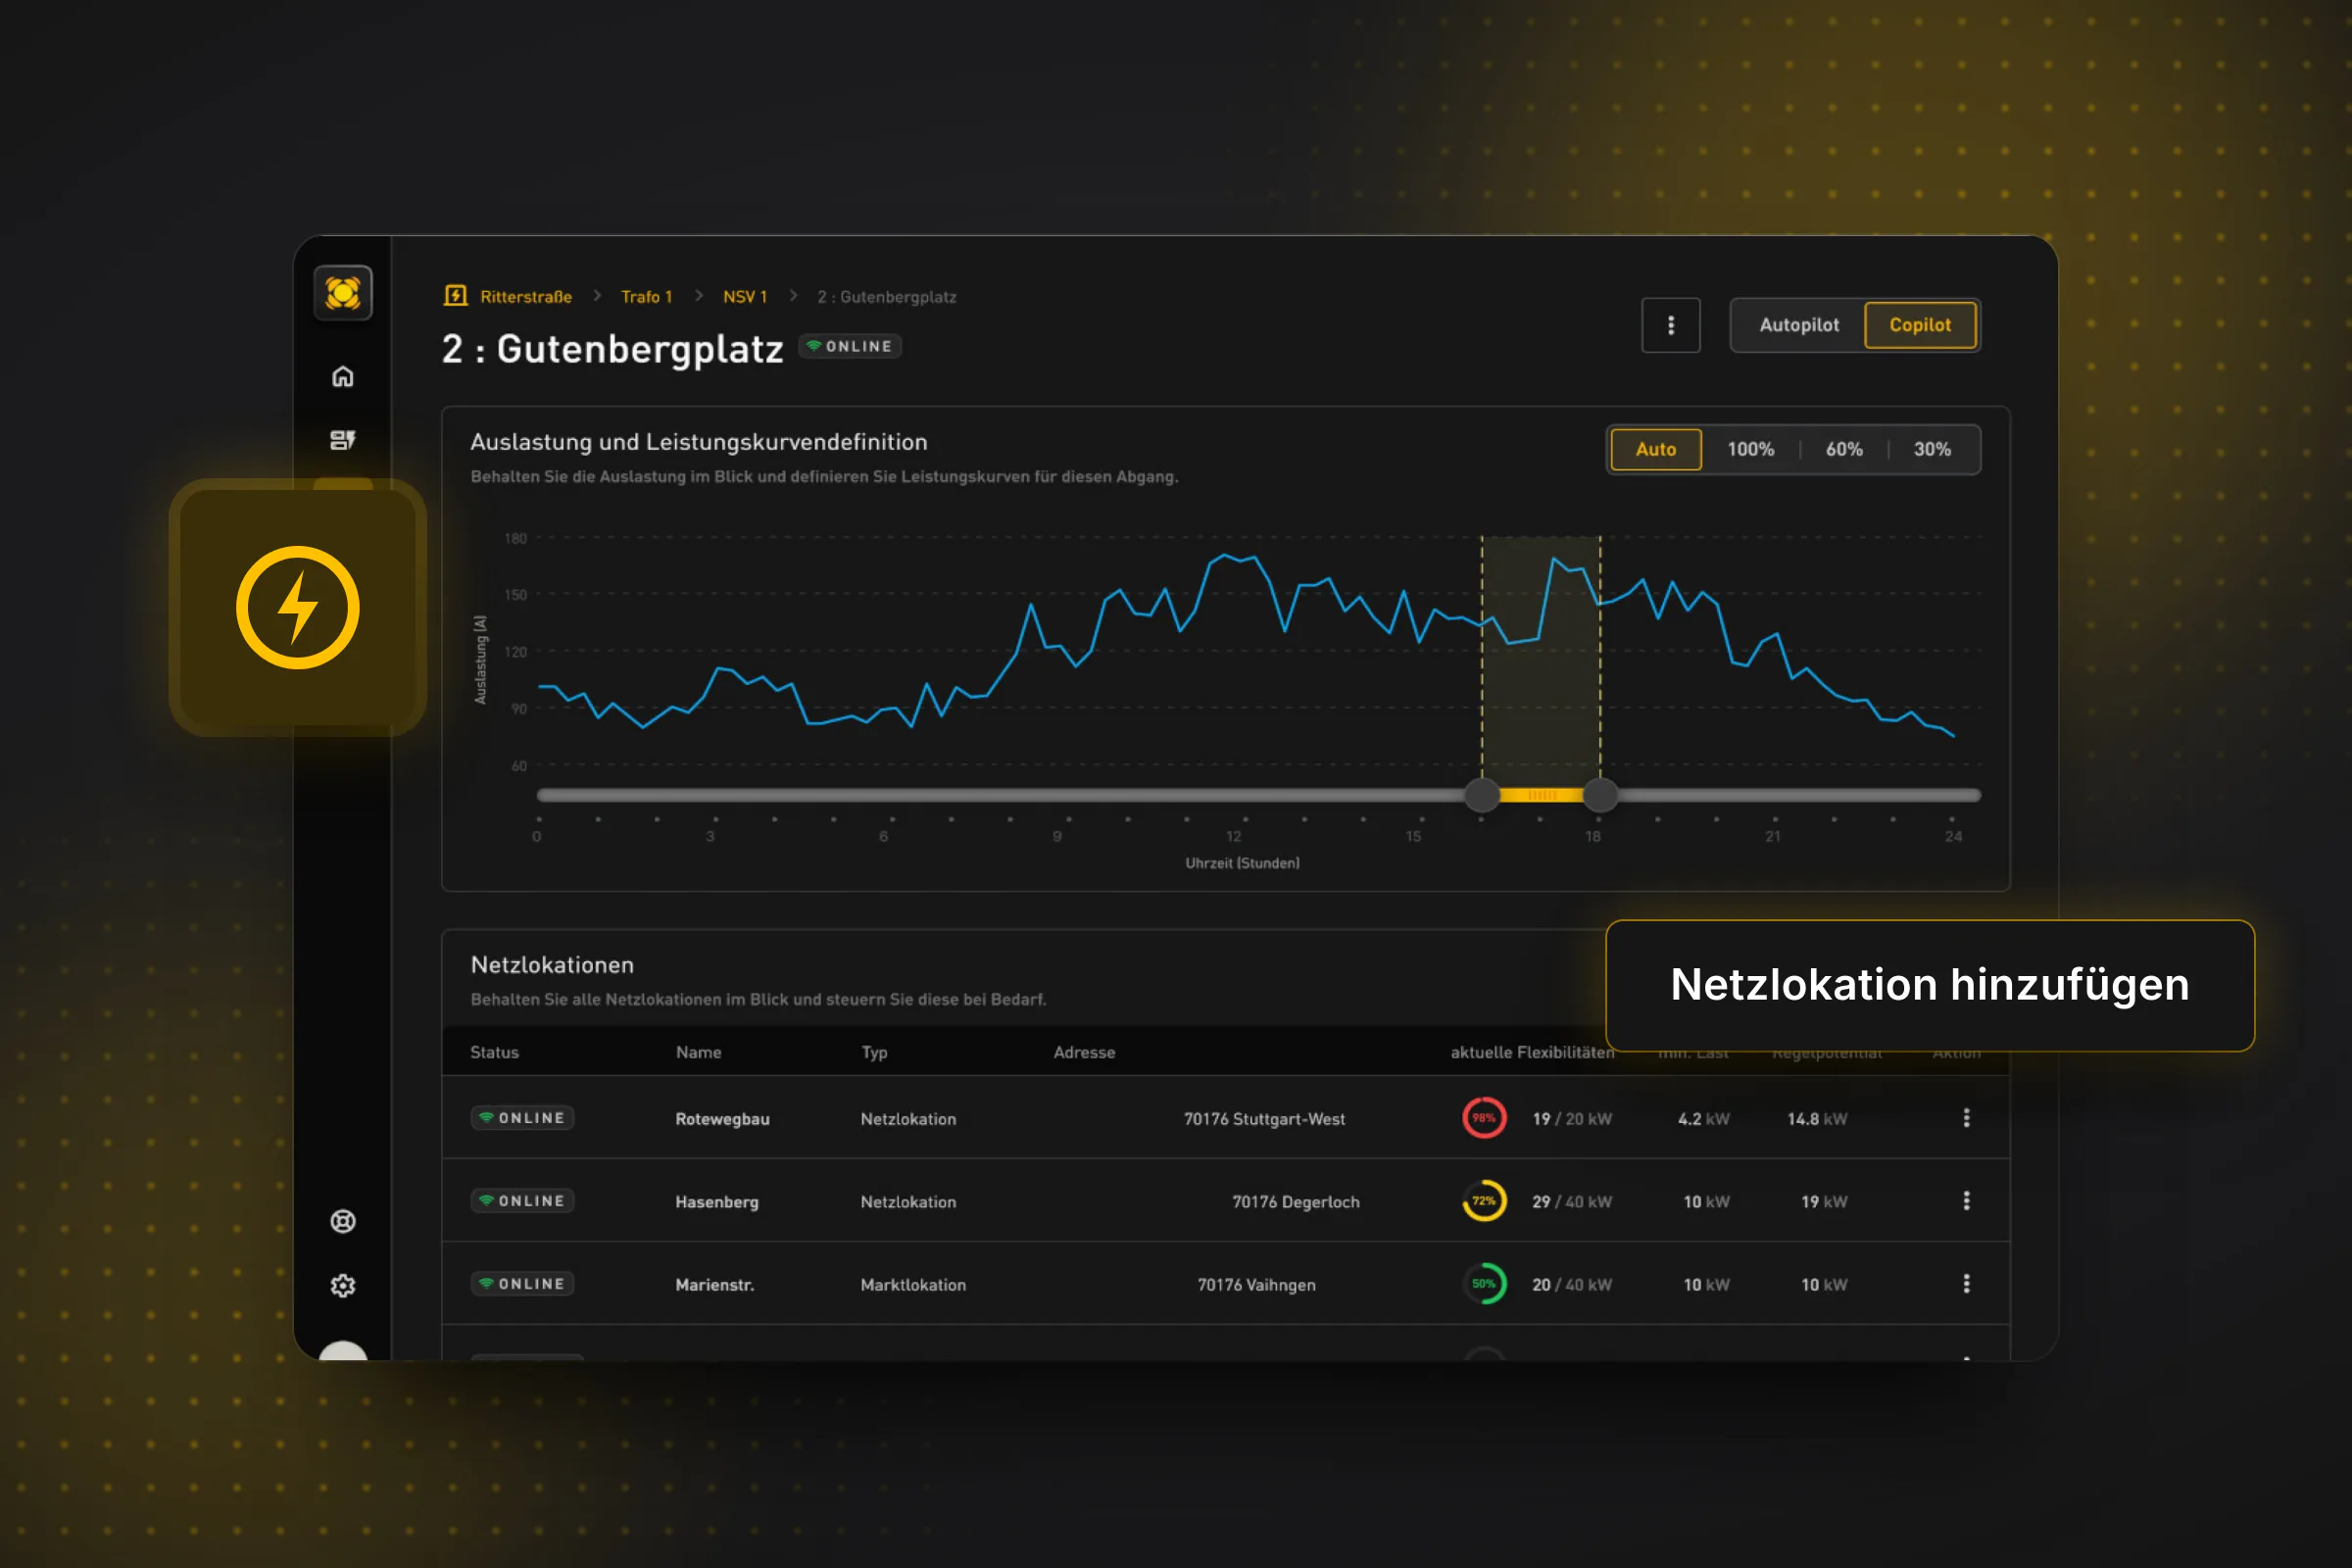
- Throttling settings right in the detail view
UI · Real time Stability through an intelligent interface
Detect and steer load peaks in real time instead of expanding grids at great cost.
- Switch between Copilot and Autopilot
- Encrypted dimming commands via the BDEW Web API
From the measuring point to the heat pump
Robust, encrypted interfaces between all parties.
The interface in detail
A dark surface with yellow accents: the UI is made for focused work in grid operations. Single features enlarged in focus.
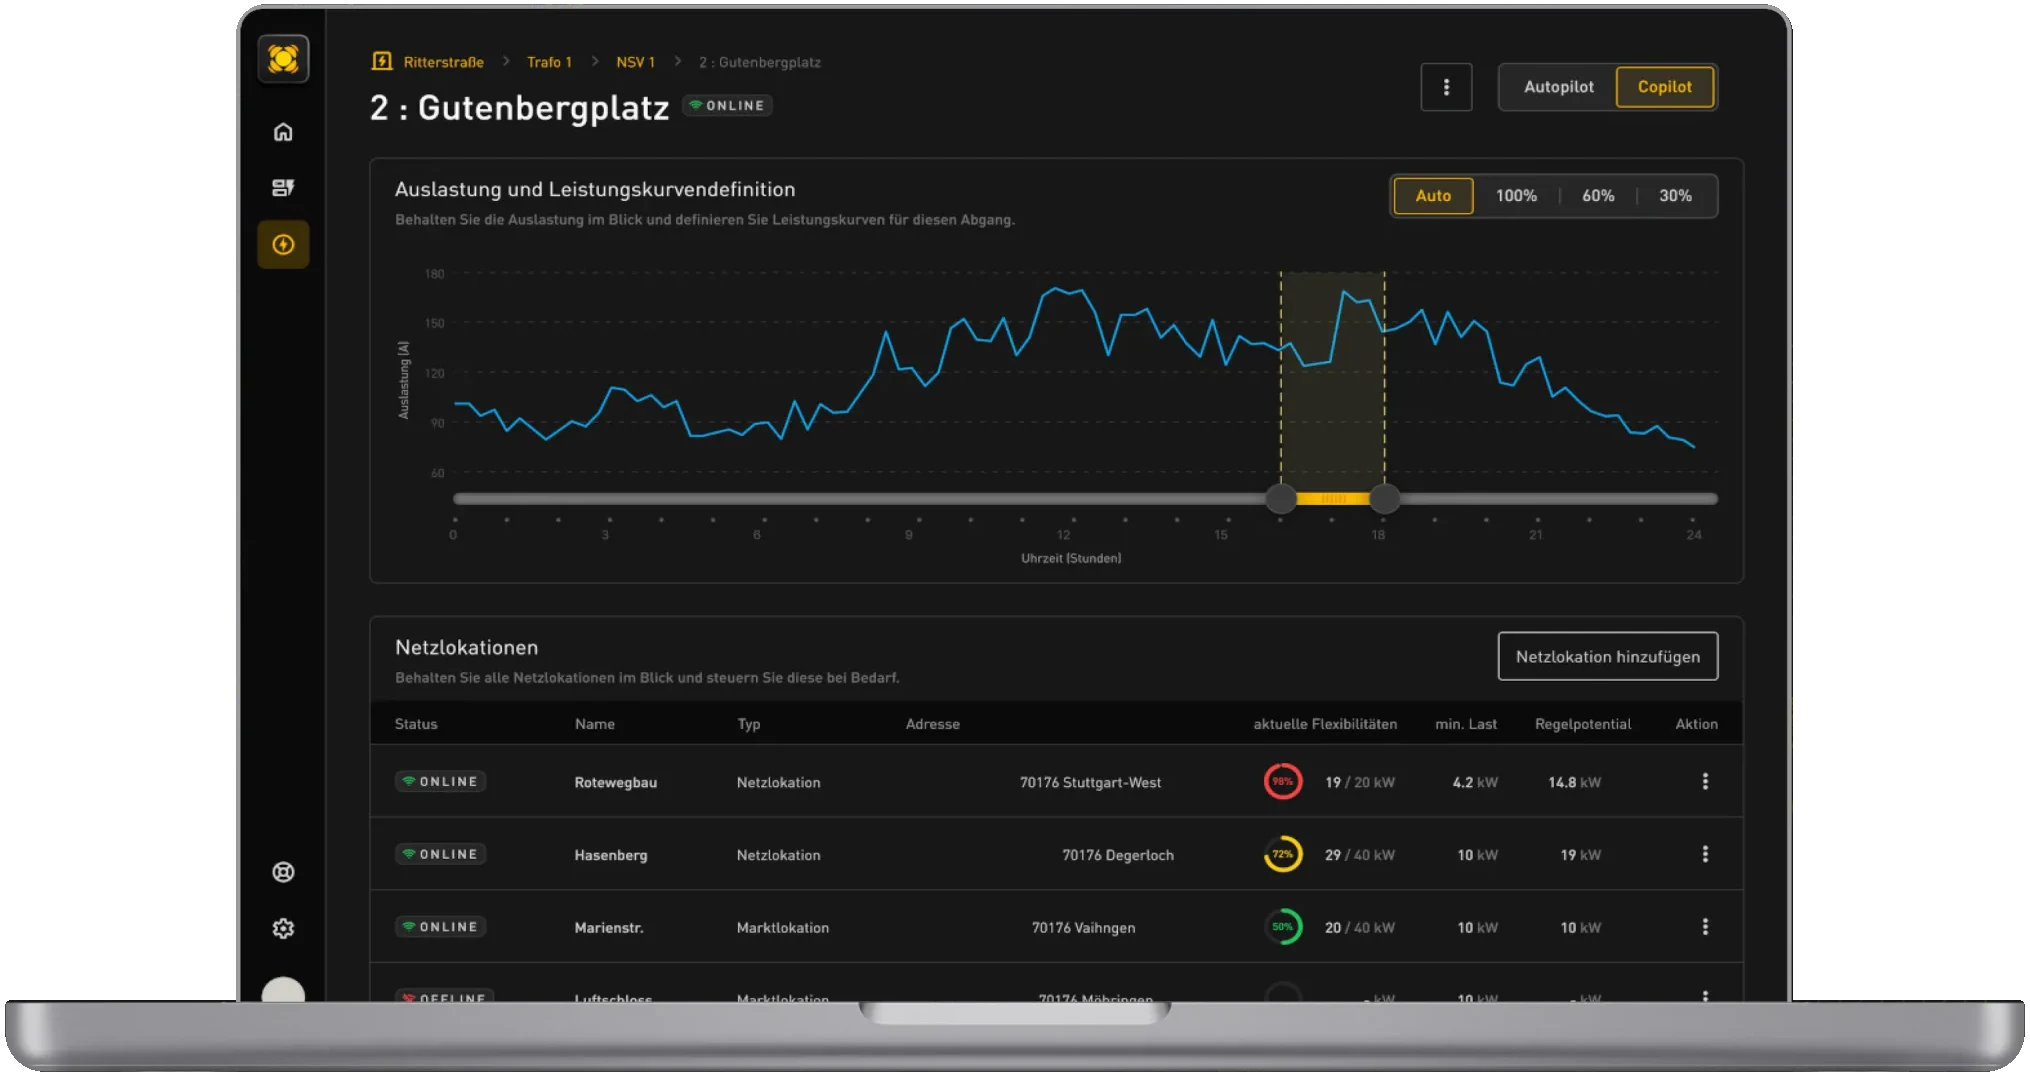
Grid load and throttling settings of the feeders in one view
The digital transformation of distribution grids demands interfaces that turn highly complex real-time data into split-second, error-free decisions. The central UX value of this design is the seamless bundling of grid load and throttling settings in a single, consolidated view.
-
Monitoring and control together
Instead of the classic breaks between isolated monitoring dashboards and separate control screens, the workspace unites time-series analysis directly with the control elements under § 14a EnWG.
-
Control directly in the chart
Following the principle of direct manipulation, an interactive time-range scrubber in the load chart defines time corridors, while fixed dimming levels (30 %, 60 %, 100 %) place control actions precisely in the visual context of looming load peaks, drastically reducing cognitive load.
-
Orientation in the grid topology
This control focus is flanked by a considered information architecture: a topological breadcrumb cascade and unambiguous entity names anchor the feeder in its switch cabinet and grid context.
-
Load at a glance
In the object list below, the data density pattern ensures efficiency – compact, colour-coded radial gauges make the utilisation and control potential of grid locations readable at a glance, precisely distinguished by market and grid location.
-
Clear contrasts for grid operations
Realised in an ergonomic high-contrast dark theme for control rooms, the result is a product design that makes highly regulated, critical infrastructure intuitive, fault-tolerant and future-proof to manage.


Assigning grid locations
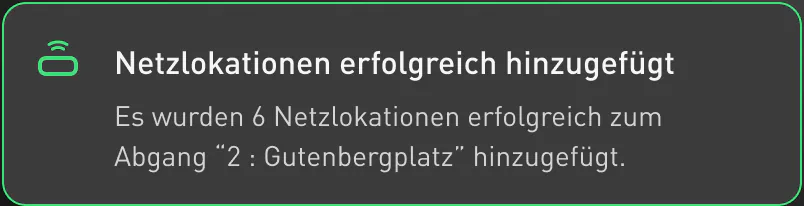
From master-data import to traceable assignment in the grid model: a guided workspace connects the checklist, map and status. Grid operators can review controllable devices such as heat pumps and wallboxes in their spatial context.
-
Guided workflow
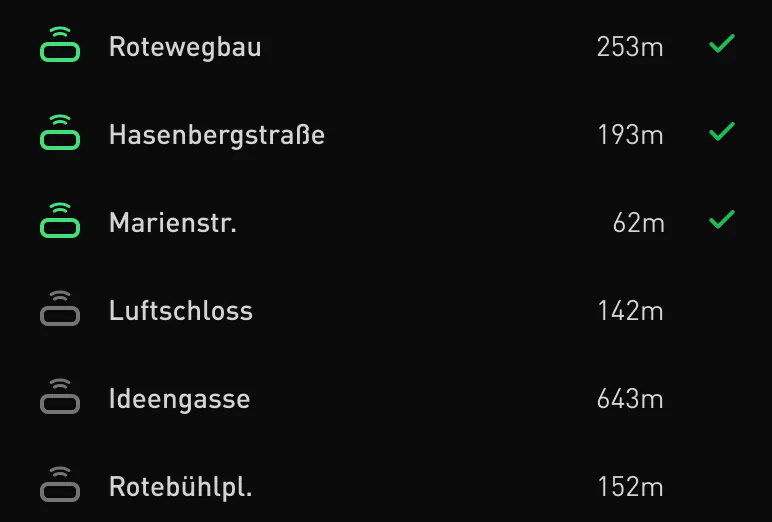
the two-step “Check and assign” process breaks the task into manageable stages. Grid operators can review assignments before the final import without having to keep every input in mind at once.
-
Linked list and map
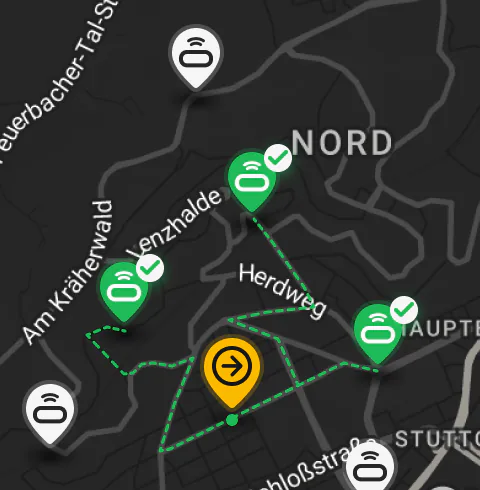
selecting an entry in the worklist highlights its grid node and connection on the map. This brushing and linking brings master data and geodata into one workspace, making spatial orientation easier.
-
Distance-based plausibility checks
the calculated distance to the substation provides an additional cue when reviewing an assignment. Unusual distances can be investigated directly on the map before the assignment is accepted.
-
Visible progress
green check marks identify reviewed entries, yellow focuses the active position and pending entries stay neutral. An import confirmation makes completion clear and provides feedback on the work completed.
-
Details in context
the enlarged topology view makes individual feeders readable while the wider map remains a point of reference. Focus and context connects detailed review with orientation across the service area.
-
Calm surfaces, clear signals
the dark UI separates the map, worklist and detail information. Deliberate contrasts draw attention to review status and selection, reserving functional colours for relevant feedback.
-
A connected workflow
import, review and grid topology work together. Assignments do not have to be reconstructed across separate spreadsheets and map views; visible status supports traceable processing.
§14aEnWG
Legal basis for grid-oriented control since 1 January 2024
3parties
Grid operators, metering point operators and suppliers connected through robust interfaces
1product
new on the market, designed and developed together with inovex